Kingston Home Prices

Kingston City Hall and waterfront on a clear day — Kingston Market Update as at July 31, 2025

Kingston Market Update — August 2025

Prices steady. More choice. Buyers have leverage; preparation still wins for sellers.

Market at a glance: Prices steady; inventory ~4.8–4.9 months (buyer tilt). Prep + right pricing = near‑ask; buyers have time and leverage.


By the Numbers (July — Kingston & Area)

  • Sales: 310
  • New listings: 714
  • Active listings: 1,479
  • Sales-to-new-listings ratio: ~43% (balanced, buyer‑lean)
  • Months of inventory: ~4.8–4.9
  • Average price: $613,160
  • Median price: $587,150
  • Sale-to-list ratio: 96.8%
  • Median days on market: 27 days
  • HPI (Kingston city) composite: $585,100
  • HPI by type (Kingston city): Single‑family $626,400 • Townhouse $478,400 • Apartment $393,500

Source: KAREA/CREA July 2025 report. Benchmarks (HPI) reflect “typical” home values and smooth out outliers. Averages/medians reflect actual sales for the month.

Values Holding — Product & Condition Decide

Kingston real estate values held steady in July. Average and median prices held steady as well. The city HPI composite sits in the mid‑$500s. No broad decline—results hinge on product, condition, and micro‑location. Move‑in‑ready homes still sell near ask. Dated or mispriced listings negotiate.

What helps: professional photos, fresh paint/lighting, tidy curb appeal, and pricing against the latest solds.

More Listings, More Leverage

Active listings are at multi‑year highs. With months of inventory near five and a sales‑to‑new‑listings ratio in the low‑40s, the market is balanced with a buyer tilt. More homes to compare. More time to think. More leverage on properties that need work or have sat.

Timing: turn‑key homes can list now and win. If prep is needed, tune up in late August and launch after Labour Day.

Homes Still Move — At a Measured Pace

Median time on market is 27 days. The best‑presented homes draw strong week‑one traffic and clean offers. Others take longer and negotiate more.

  • Deep clean and touch‑ups
  • Front‑yard refresh
  • Scent‑free showings
  • Launch price aligned to the latest solds

Where the Value Is — By Type

  • Single‑family: ~$626K. Stable when well‑kept and well‑located.
  • Townhouses: ~$478K. Softer vs. last year—good value for first‑timers and downsizers.
  • Apartments/condos: ~$394K. Mixed by building; well‑run, well‑located towers see steadier demand.

How to read this: HPI is a benchmark of a “typical” home. Your home’s story (lot, updates, exposure, layout) will push you up or down from these anchors.

What This Means for You — How to play August

If you’re selling

  • Price to today, not last spring. Use the last 30–60 days of comps.
  • Win week one. A‑grade photos, copy, and show‑ready prep.
  • Fix the $20 problems. Caulk, paint, lights, door hardware, squeaks.
  • Set your price lane. Conservative / likely / stretch—and stick to it.

Pro tip: Book a 20‑minute photo scout. We’ll walk the home and prioritize the shots and fixes that matter.

What’s a “Price Lane”?

A price lane is a pre‑planned range you pick before launch so you don’t price by gut after you go live. We base it on adjusted comps (last 30–60 days), the active competition, and today’s market tone.

  • Conservative: Adjusted Fair Value (AFV) minus ~1–2.5%. Goal: strong week‑one traffic and higher odds of clean terms.
  • Likely: AFV ± ~0–0.5%. Goal: fair market value with typical days on market.
  • Stretch: AFV plus ~2–4% (rarely up to 5% for one‑of‑a‑kind). Goal: test upside when the home is scarce/exceptional.

Pre‑commit your moves: Day 7–10, if showings and saves are soft, shift from Stretch → Likely (~−2%). Day 14–21, if feedback cites price, Likely → Conservative (−1–2%). If activity is strong with multiple buyers circling, hold your lane and negotiate terms.

Example (AFV = $600,000): Conservative $587,900–$594,900 • Likely $599,000–$604,900 • Stretch $612,000–$624,000.

If you’re buying

  • You have time. Compare. Walk the street morning and evening.
  • Shop payment and product. We’ll balance fixed/variable terms with the home that fits your life.
  • Look past the beige. Cosmetic work often hides value; structure and location carry the day.
  • Mind the condo math. Fees, reserve fund health, and rules shape the monthly.

Pro tip: Ask for our “3‑offer map” — three realistic offer strategies tailored to your budget and the specific home.

Street‑Level Truths

City averages hide street realities. Walkable south‑end pockets, strong school catchments, and renovated bungalows in mature areas still draw steady demand. On the fringe, homes needing updates see more price discovery.

Ask for a micro‑report: last 60–90 days of solds on your street, active and pending competition, and a clear pricing lane. Email Jay for your micro‑report →

Methodology & Notes

  • Averages/medians: reflect actual July sales.
  • HPI (Home Price Index): a benchmark “typical” home; removes outliers to track value trends.
  • Market balance: sales‑to‑new‑listings ratio and months of inventory describe buyer/seller leverage.
  • Data source: KAREA/CREA July 2025.

Ready to plan your next move?

A 15‑minute consult now can save weeks later. We’ll map pricing, prep, and timing so you can move with confidence.

Jay & Sean Gazeley
Brothers. REALTORS®. Here to help you move with confidence.
Jay: 613.561.4653  |  Sean: 613.888.9267  |  Turner: 613.876.5406
jay@gazeleyrealestategroup.ca  |  sean@gazeleyrealestategroup.ca  |  turner@gazeleyrealestategroup.ca

Is Kingston’s market cooling?

It’s balanced with a buyer tilt. Well-priced, turn-key homes still move quickly; others take longer and negotiate more.

Are prices dropping?

No broad drop — averages are steady and HPI anchors are stable. Results vary by product and condition.

Where are the best values right now?

Townhouses and some condos, or detached homes that need light cosmetic work.

What’s months of inventory right now, and what does it mean?

About 4.8–4.9 months. That’s balanced with a buyer lean—more choice and a bit more negotiating room. Sellers should price to today’s comps and present clean.

What’s a realistic sale-to-list range in this market?

July averaged ~96.8%. Show-ready, well-priced homes land near ask; properties needing updates tend to negotiate more.

Kingston, ON Real Estate Market Update & Outlook: February 2024

Welcome to our February 2024 update on Kingston’s real estate market! It’s an exciting time for both home buyers and sellers as we see some interesting changes. Our goal is to give you a clear picture of what’s happening in the market, along with some insights into where things might be heading.

Let’s dive into the details together.

What’s Happening Right Now?

Homes Coming Up for Sale:

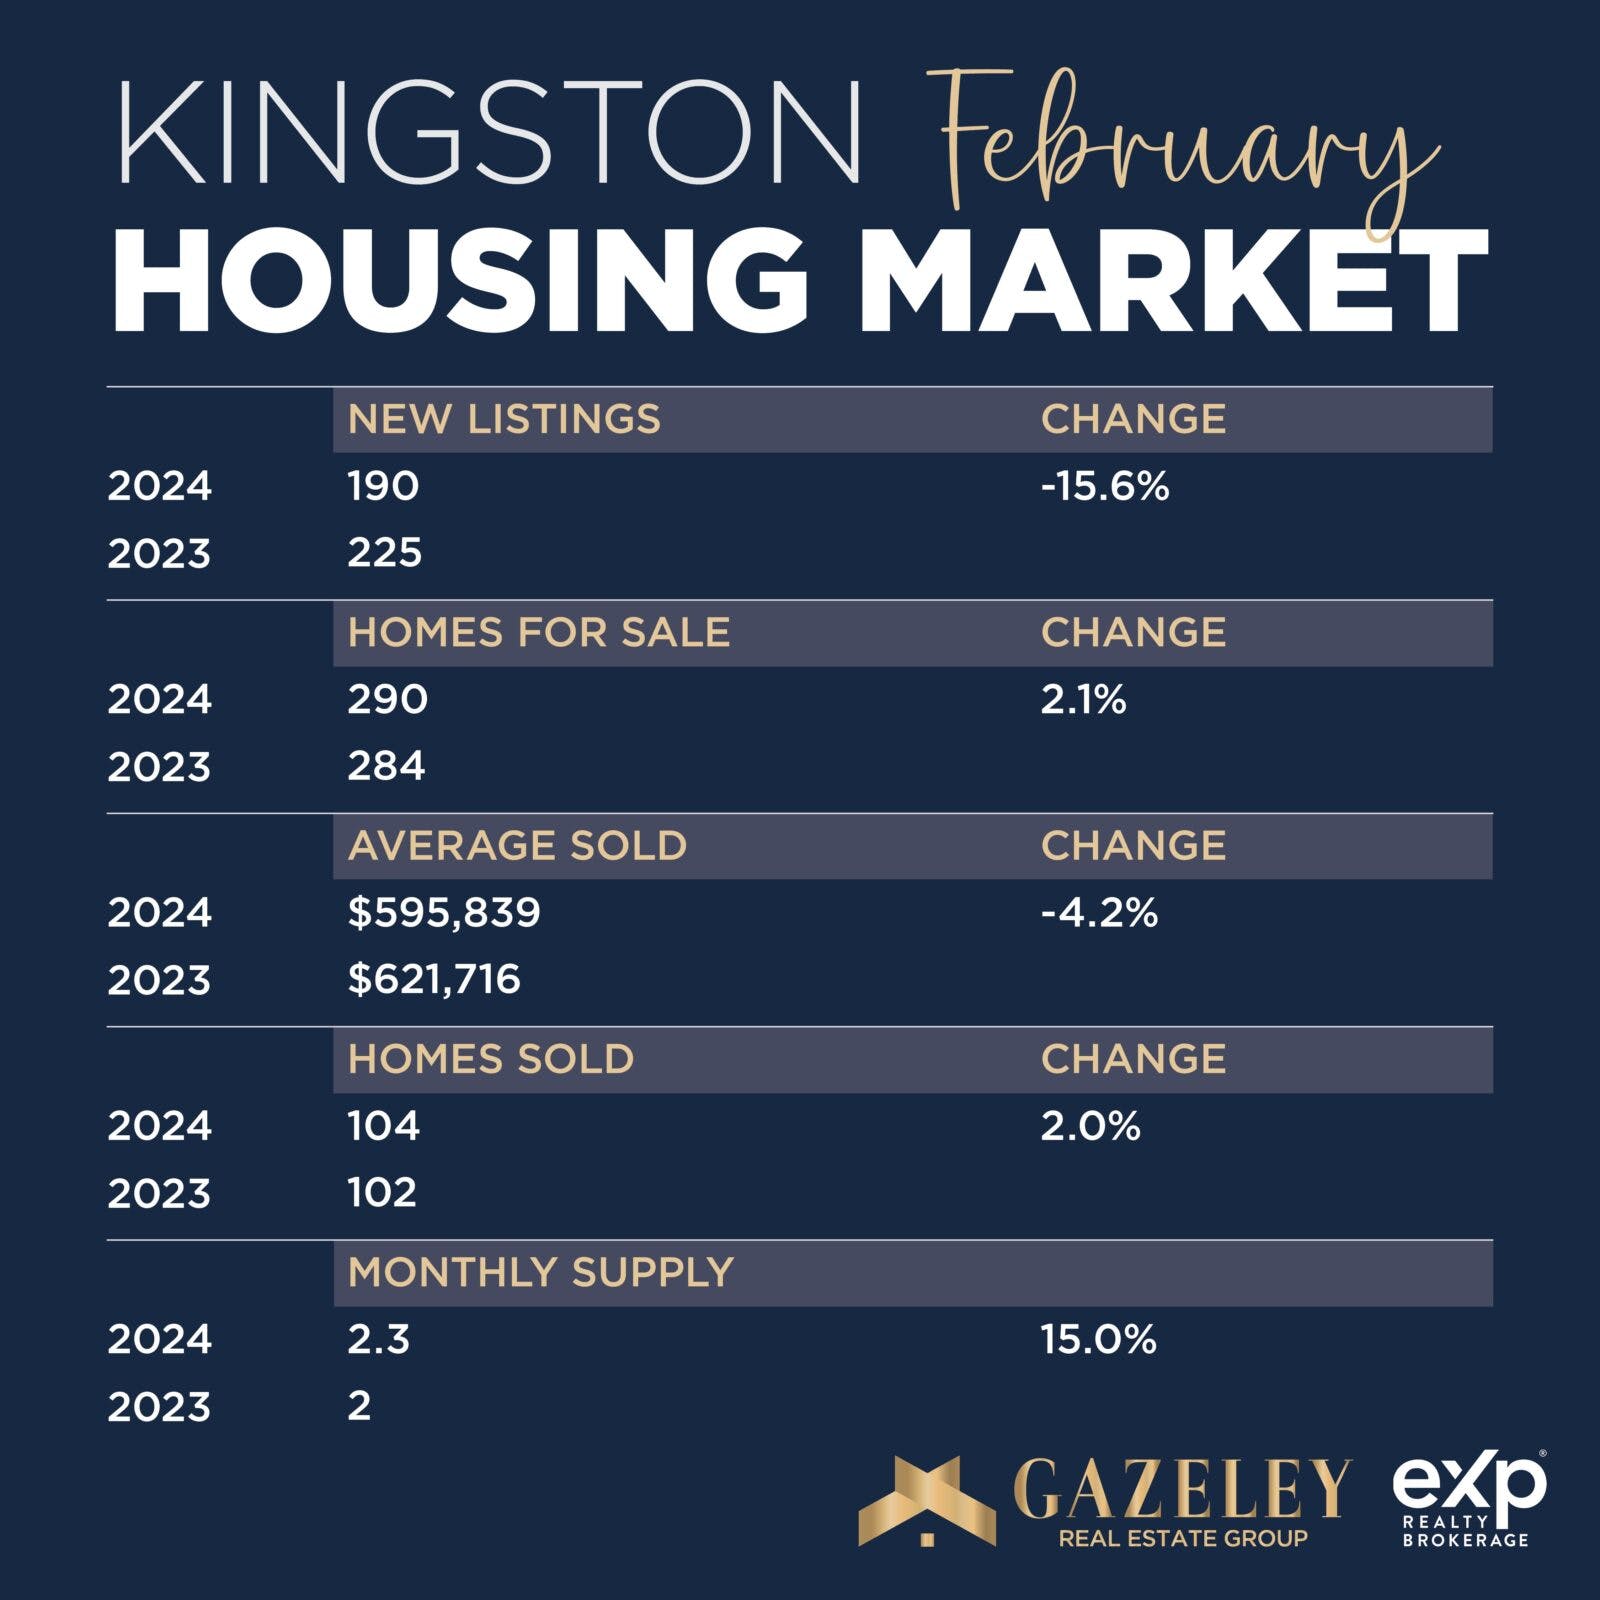
In February, we noticed fewer new homes listed for sale compared to last year – 190 this year versus 225 last year. This means there are slightly fewer choices right off the bat, but don’t worry, there’s more to the story. The total number of homes available to buy actually increased a little bit to 290. So, while there are fewer new listings, the overall selection is getting better.

How Much are Homes Selling For?

There’s been a bit of a shift in prices too. The average selling price has come down a bit to $595,839 from last year’s $621,716. But, looking at the brighter side, prices picked up a bit from last month, showing that the market is holding strong and people are still keen on buying.

Are People Buying Homes?

Yes, they are! In fact, 104 homes were sold in February, which is a good sign of activity in the market. This shows that despite the ups and downs, people are actively buying homes, making it a lively market.

What Does the Supply Look Like?

There’s a little more breathing room now with a supply of homes lasting about 2.3 months, up from 2.0 months last year. This means buyers might have a few more options to choose from and a bit more time to make their decisions.

Looking Forward: Insights and Predictions

Interest Rates and the Economy:

The market is also influenced by interest rates and the economy. Lower interest rates can make borrowing cheaper, encouraging more people to buy homes. However, if rates go up, it might slow things down a bit. Kingston’s job market and population growth are also big factors. A strong job market and more people moving to Kingston can keep the demand for homes high.

On March 6, 2024, the Bank of Canada announced that its key interest rate would remain at five percent, where it has stayed since July. Many economists anticipate the first interest rate cut will come in July, given that the inflation rate is holding within the bank’s target range. So, for homeowners facing mortgage renewal this year it might still be beneficial to choose a shorter-term mortgage so that when rates do come down, they can take advantage of better rates. This is a great discussion to engage in with your mortgage agent.

What’s Next for 2024 and Beyond?

We’re expecting the market to find a nice balance in the coming months. Prices might not swing too wildly, and there should be a steady flow of homes to choose from. This could be great for both buyers and sellers, offering fair prices and enough options.

Conclusion

Navigating the Kingston real estate market in February 2024 is like setting off on an adventure with a good map in hand. There are plenty of opportunities for buyers to find their dream home and for sellers to get a fair price. With a bit of patience and the right information, everyone can make a move that feels just right.

We’re here to help guide you through these exciting times with a friendly and professional approach. Whether you’re looking to buy your first home or sell your property, the journey ahead is filled with promise.